
Radar reads: Your guide to epic kite sessions
Packed the van, raced to the beach, only to meet drizzly wind? Every kiter knows the pain. Radar puts real‑time eyes on the sky, letting riders swap frustration for informed decisions.
Radar basics, why we should care
Radar sends out microwave pulses, waits for the echo, and paints a picture of what is floating in the air right now. Reflectivity shows how much stuff is up there and the velocity shows how that stuff moves. Forecasts guess hours ahead, radar shows the present moment you are about to launch in.
Real‑life link: The same tech guides pilots around storms and helps drivers dodge motorway downpours. If it saves a plane, it can save a kite session.
Precipitation and power
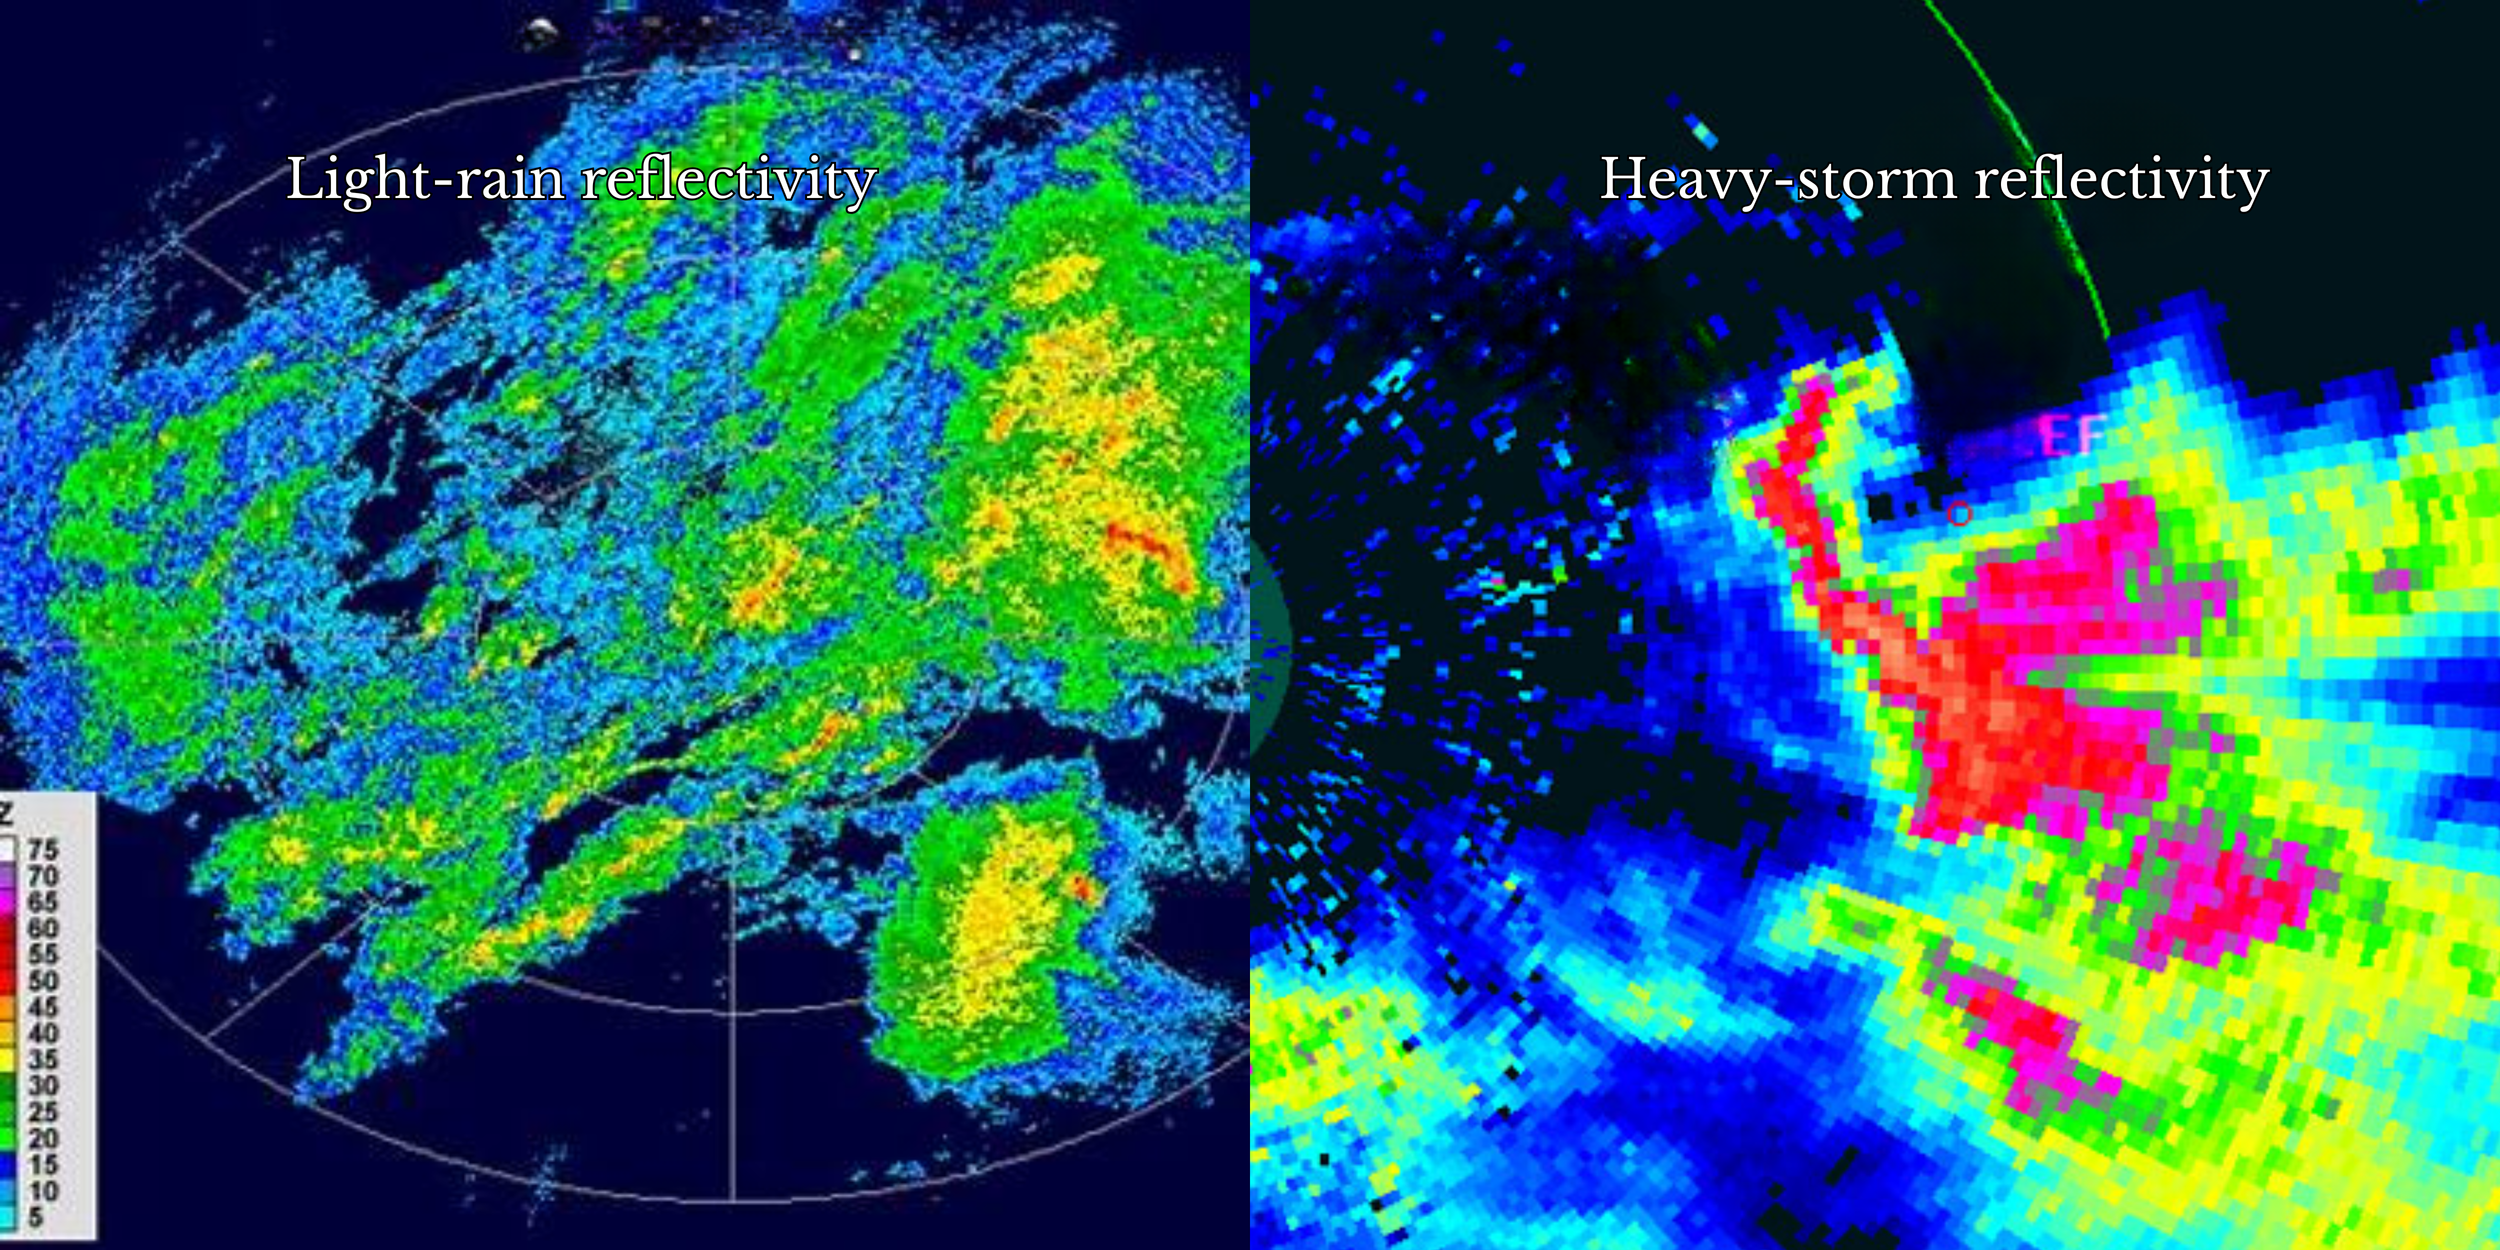
Colors tell you whether the sky is spraying mist or throwing nails. On most European radars green or light blue means drizzle, yellow to orange means steady rain, red or purple screams thunder punch. The numbers behind the colors are dBZ.

Look at the left image for a textbook drizzle pattern and the right image for a bow‑echoing wall of doom.
Unmasking the wind dance with velocity
Think Doppler radar as a police speed gun for raindrops. The radar sends out a microwave pulse at a known frequency. If the drops move toward the dish, the returning echo is squeezed (higher frequency). If they move away it is stretched (lower frequency). The computer converts that frequency shift into radial velocity, the component of the wind blowing straight toward or away from the radar.
On most viewers:
Green/blue shades = motion toward the radar (negative values).
Red/orange shades = motion away (positive values).
Brighter shades = faster speeds.
Because the beam only sees motion along its line, it misses wind blowing exactly across it, so velocity is best read in broad patterns rather than exact numbers.

How to use it as a kiter
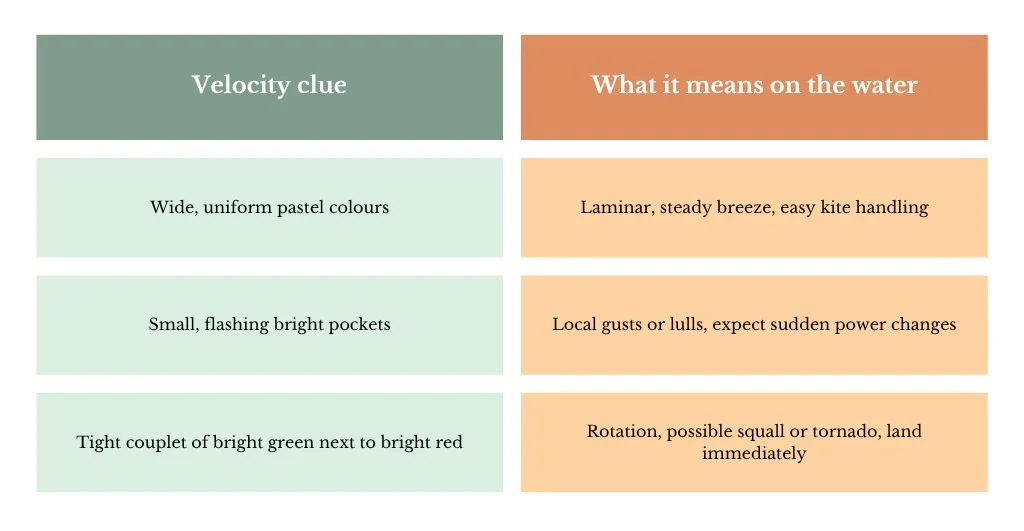
Pro move: Scroll the velocity animation. If the colours do not jump around frame‑to‑frame the wind is likely smooth, if they strobe like disco lights it will be a rodeo.
Spotting storms and squalls
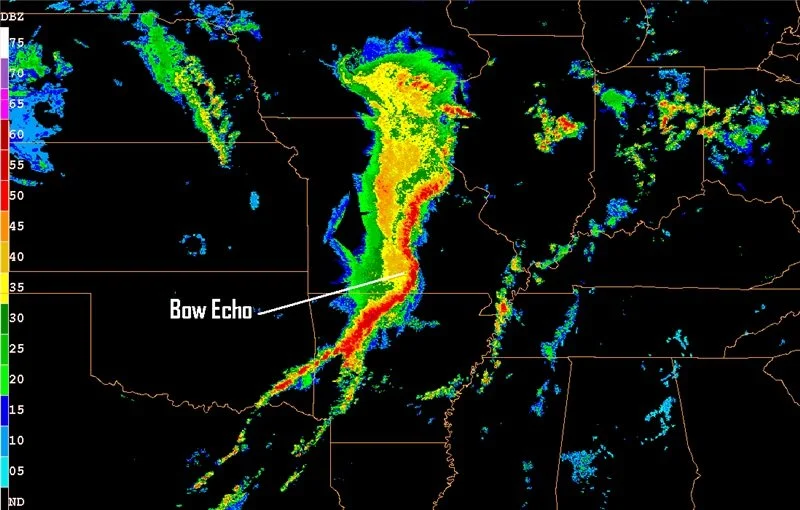
A squall line is a long, narrow band of thunderstorms that usually forms along or ahead of a cold front. On reflectivity it looks like a red or purple bar stretching tens or hundreds of kilometres. These lines surge forward driven by their own gust front, producing:
Abrupt wind shifts (often 20‒40 knots in seconds)
Heavy rain and lightning
Bow echoes where part of the line bulges outward signalling the strongest straight‑line winds
If a squall line is upwind of your beach, you have minutes, not hours. Land, pack, and watch the show from a café.
Radar limitations, know the blind spots
Radar is brilliant but not magic.
It does not see fog, sea spray, or tiny mist that lacks enough droplets to bounce signal.
Beam height rises with distance. Because the Earth curves away, the beam sits higher above sea level the further it travels (roughly 1 km up at 100 km distance). Low‑level showers or sea‑breeze jets under the beam’s path may go unseen if you are far from the radar.
Small coastal radars refresh every two to five minutes, plenty for squalls, yet still a little lag if you watch a fast moving front.
Range and location
Always use the nearest station. Twenty kilometres out the beam may already be several hundred metres above sea level. If your local launch lies between two stations, compare both views to fill any blind alley.
How to pick the best station?
Shortest straight‑line distance to your beach (use the station map layer in Windy or Meteox).
Clear path, no big hills, buildings, or islands between dish and coast.
Lower initial beam angle if the service lists it (0.3° beats 0.8° for low‑level coverage).
Many apps let you tap a radar cell to see which station provided it. If in doubt, open both neighbouring stations and blend the information.
Nowcasting loops
Most radar sites offer an animation that projects echo movement a short distance in time. This is raw extrapolation, not a full forecast model, so treat the loop like a sneak preview, good for timing a break in showers, not for planning tomorrow.
Combining forecasts, local wisdom and radar
Start with Windguru, Windy, or iKitesurf to choose a likely spot. Check radar for incoming rain bands or gust fronts. Finally, ask a beach regular, "does the sea breeze fill in here after lunch?" That three‑layer check prevents both wasted drives and unexpected beatdowns.
Common radar mistakes
Watching a single still image, ignoring the animation.
Trusting colors without reading the legend, every app scales differently.
Skipping velocity, thinking reflectivity equals wind.
Relying on radar alone, forgetting local thermal quirks.
Zooming too far out so small but nasty cells look harmless.
Putting it all together
08:00 - forecast shows 25 knots side‑shore at Dolphin Beach.
09:00 - radar reflectivity clear, velocity uniform pale green, good.
09:30 - animation hints a thin yellow band arriving at 11:00. Decide on a 9 m² kite, ride more or less two hours, land when that band hits.
11:05 - first drops, gust front spikes velocity colors, kites already on the sand. Hot chocolate/breakfast coffee earned.
Useful radar resources
Windy.com offers global radar layers plus model overlays.
RainViewer.com stitches multiple European radars into one smooth animation.
Meteox.com provides high‑resolution Benelux radar with five minute updates.
Radar powered rides await
Mastering radar is like adding a weather cheat code to your toolkit. Read the colors, watch the wind dance, respect the red flags, and you will swap sketchy launches for legendary sessions. Grab your board, check the beam, and kite on, Berito out.
xox Berito